SingleStore Tools is a new set of command line programs for managing the clusters of servers or instances that make up your database. You can use SingleStore Tools to help you find and fix problems with SingleStore quickly and incisively. Our legacy management tool, SingleStore-Ops, generated cluster reports, with output logs and diagnostics per cluster. For efficiency, the SingleStore team developed an internal tool called ClusteRx, to parse the reports coming out of SingleStore-Ops. We are now sharing this functionality with our customers as two new commands in SingleStore Tools, memsql-report collect and memsql-report check. Read on to learn how these tools can help you find and fix problems fast.
At SingleStore, we are continuously working to enhance the monitoring and troubleshooting tools for the database, and aiming to create an engine that is fully self-healing. While this is the end goal we are striving towards, it is not a small feat. Today, it is often beneficial to understand the point-in-time health of the SingleStore system (the host, the nodes, and the database itself). These types of health assessments are most useful when you are troubleshooting an ongoing issue that does not have a clear root cause. Specifically, these health checks can be useful in cases where a user may need some hints or indicators that will give them direction on where and how to start investigating a particular symptom.
Perhaps you notice that some of your application queries are failing intermittently, but there is no obvious culprit. Where do you start troubleshooting the issue? You might go through a slew of system checks, but you aren’t sure if you’re simply chasing the white rabbit. How do you narrow down the problem? We’ll get back to this example shortly…
Past Health Checks at SingleStore
SingleStore has a legacy management tool called SingleStore-Ops, which runs in conjunction with the database. SingleStore-Ops has the ability to generate what we call a cluster report, which output logs and other diagnostics on a given cluster. It’s an informative report – but it can be challenging to navigate if you don’t know where to start your investigation. It’s a classic ‘finding a needle in a haystack’ problem. When a customer filed a customer support ticket, the SingleStore support team typically requested that they run this report, and the support team then used the report to help fix problems. (If you have filed a case with our teams, you are probably very familiar with how to collect a report).
Over time, the SingleStore support team learned what critical data points in these dense cluster reports offer the most insight to nail down or troubleshoot an issue. This feedback loop led to an internal tool that was developed by the support team, called ‘ClusteRx’ (notice the ‘Rx’ health pun!). ClusteRx parses the cluster report and provides an output that notifies the support team of various pass/fail checks that can be used as indicators on where the root cause of a particular problem may lie. (We will provide a practical example a little later on in the article).
Making the Internal Tool External
This internal tool, developed by our support team, became so useful for helping to troubleshoot a cluster experiencing problems that we decided to make it available to our customers. This is very exciting, because making this feature available to our customers enables them to troubleshoot SingleStore without assistance, and it also ensures they are equipped with the information and tools they need to manage their SingleStore cluster successfully.
Fast forward to the present day: We redesigned our entire management tool into a new framework called SingleStore Tools, which replaces SingleStore-Ops. We took the lessons learned from the internal ClusteRx tool for point-in-time health assessments that SingleStore support and engineering iterated on together, and we applied them to new functionality within SingleStore Tools, called memsql-report collect and memsql-report check.
What the New Tool Does
The newly redesigned version of this tool does the following:
- memsql-report collect gathers the diagnostic report from the given cluster.
- memsql-report check runs various pass/fail checkers on the report and outputs the result to the user, highlighting actionable tasks if a certain check failed.
As of this blog post, memsql-report check has 55 different checkers, and we are continuously developing more. Below are a few examples of the checkers in memsql-report check:
- outOfMemory – reports on any recent out of memory failures.
- leavesNotOnline – provides information on SingleStore leaves that are offline in the cluster.
- userDatabaseRedundancy – confirms your data is properly replicated across the cluster.
- defaultVariables – checks certain SingleStore system variables and ensures they are set to recommended values.
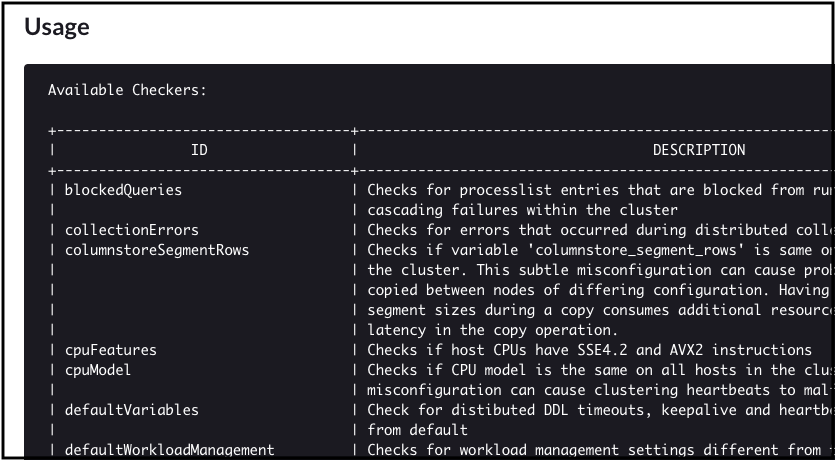
SingleStore documentation describes the 55 different checkers for memsql-report check.
The Real-Life Problem
Back to the real-life user example that we introduced at the beginning of this article…
A user noticed that a subset of their application query workload was failing, but there were no leading indicators as to why. How can we use memsql-report check to help us?
Some definitions, before we go any further:
- A SingleStore aggregator is a cluster-aware query router. It is responsible for sending all the queries to the nodes that have the data on them (SingleStore leaf nodes).
- The ready queue is a queue of all processes that are waiting to be scheduled on a core.
The customer with this issue filed a ticket with support, and support instructed them to run memsql-report collect and memsql-report check on their cluster. Using the output of memsql-report check, the customer immediately detected that the ready queue was saturated on one of the aggregators.
Each query that runs on a cluster – including internal queries used by the nodes to communicate with each other – requires exactly one thread on an aggregator; the ready queue saturation message means that the maximum number of connections allowed on that aggregator has been reached. Saturation of the ready queue typically means that queries will be queued on that aggregator, and depending on your application logic, it can lead to timeouts and failures.
This explains why some, but not all, queries were failing in the customer’s application. Tying this back to SingleStore’s report-check functionality, the customer was able to identify that the ready queue was saturated by looking at one particular checker that stood out, the readyQueueSaturated checker.
Here is the example output on the ready queue that piqued our interest:
readyQueueSaturated [FAIL]

The ready queue has not decreased on 10.22.182.7
The customer shared the output of the checker with us, and we focused on the aggregator that exhibited this failure (10.22.182.7) and identified in the processlist that there were about 50 open connections on this aggregator. Hmm. This finding was puzzling to our team because SingleStore aggregators are typically meant to handle more than 50 concurrent connections at a time. So, why were queries failing?
The Real-Life Solution
It turns out memsql-report check clued the customer in on another issue, which they brought to our attention. The aggregator was configured to only have 50 connection threads (max_connection_threads) open at once. The max_connection_threads setting on an aggregator is essentially a limit on the number of queries – including internal SingleStore queries – the aggregator will run simultaneously. The value recommended for aggregator connection threads is 192, so this aggregator was configured to service almost four times fewer connections than it was supposed to!
readyQueueSaturated [FAIL]

The ready queue has not decreased on node 10.22.182.7

Warn: Value of max_connection_threads 50 doesn't follow the recommended value 192 for node 10.22.182.7
As soon as the customer updated the value for max_connection_threads to the recommended level, 192, the issue was resolved.
Without report-check, it would have taken a lot of investigation time to get to the bottom of the issue. With this tool, you can find problems in minutes that could have taken hours otherwise.
For example, in this case, the customer would have had to check the logs for every node to identify that the ready queue was saturated on a given aggregator. Furthermore, the user would have had to check each nodes’ setting for max_connection_threads to find the misconfiguration. Both of these could have taken a significant amount of time, especially with a large SingleStore cluster.
Trying It Yourself
This scenario is one of many examples of how useful memsql-report check can be for quickly identifying and mitigating issues and limiting break-to-fix times. Many of our customers also use this tool after they deploy SingleStore, before they do upgrades, maintenance, or other significant activities, as a sanity check to confirm their cluster is in good shape.
If you haven’t used memsql-report check, you should check it out. We encourage our customers to use this to troubleshoot issues on their own! And, if you’re still stuck, reach out. Your efforts will help SingleStore Support to help you, faster and more effectively. (If you’re not yet a paying customer, your efforts will help you find help on the SingleStore Forums.)
Looking ahead, we want to expand this tool so that customers can do system checks to validate their environment before they install SingleStore, including validating performance on their hardware. Additionally, we want to incorporate some of the applicable health checks into the database engine directly.
If you have feedback on what we should add to the checker, please post in the SingleStore Forums. And see the SingleStore documentation for a full list of all the checkers. If you haven’t done so yet, you can try SingleStore for free, or contact SingleStore today.
memsql-report check Example
Below is an example of output for memsql-report check. I suggest that, when using it, you look at all the checks and review the ones that failed. For example, for the memory check failure, this user allocated a large percentage more memory to the database than is actually available on their machines. In this case, I would adjust maximum_memory on all my nodes to ensure my cluster is within physical memory limits.
| ✘ maxMemorySettings ……………………….. [FAIL] |
|---|
| FAIL total maximum_memory of all nodes on 127.0.0.1 too high (180% of RAM) [7106/3947] |
| bash-4.2\$ memsql-report check –report-path /home/memsql/report-2019-12-20T012005.tar.gz |
|---|
| ✓ explainRebalancePartitionsChecker …………. [PASS] |
| ✓ queuedQueries …………………………… [PASS] |
| ✘ defaultVariables ………………………… [WARN] |
| WARN internal_keepalive_timeout is 90 on F91D002A777E0EB9A8C8622EC513DA6F0D359C4A (expected: 99) |
| WARN internal_keepalive_timeout is 90 on 5E8C86A7D53EFE278FD70499683041D4968F3356 (expected: 99) |
| ✓ memsqlVersions ………………………….. [PASS] |
| NOTE version 6.8.13 running on all nodes |
| ✘ vmOvercommit ……………………………. [WARN] |
| WARN vm.overcommit_memory = 1 on 127.0.0.1. The Linux kernel will always overcommit memory, and never check if enough memory is available. This increases the risk of out-of-memory situations |
| ✘ maxMemorySettings ……………………….. [FAIL] |
| FAIL total maximum_memory of all nodes on 127.0.0.1 too high (180% of RAM) [7106/3947] |
| ✓ leafAverageRoundtripLatency ………………. [PASS] |
| ✘ detectCrashStackTraces …………………… [WARN] |
| WARN data from SingleStoreStacks collector unavailable on host 127.0.0.1: /tmp/memsql-report656183805/127.0.0.1-MA-LEAF/memsqlStacks.files.json not found |
| ✓ failedBackgroundThreadAllocations …………. [PASS] |
| ✓ columnstoreSegmentRows …………………… [PASS] |
| NOTE columnstore_segment_rows = 1024000 on all nodes |
| ✓ tracelogOOD …………………………….. [PASS] |
| ✓ runningBackup …………………………… [PASS] |
| ✓ interpreterMode …………………………. [PASS] |
| NOTE interpreter mode INTERPRET_FIRST found on all nodes |
| ✘ userDatabaseRedundancy …………………… [WARN] |
| WARN this cluster is not configured for high availabililty |
| ✘ maxOpenFiles ……………………………. [WARN] |
| WARN fs.file-max = 524288 might be low on 127.0.0.1, recommended minimum is 1024000 |
| WARN open files ulimit (1048576) is set higher than fs.file-max value (524288) on 127.0.0.1 |
| ✓ offlineAggregators ………………………. [PASS] |
| ✘ outOfMemory …………………………….. [WARN] |
| WARN dmesg unavailable on host 127.0.0.1: error running command: `”/usr/bin/dmesg”`: exit status 1 |
| ✓ kernelVersions ………………………….. [PASS] |
| NOTE 4.9 on all |
| ✓ replicationPausedDatabases ……………….. [PASS] |
| ✓ mallocActiveMemory ………………………. [PASS] |
| ✓ missingClusterDb ………………………… [PASS] |
| ✓ failedCodegen …………………………… [PASS] |
| ✘ numaConfiguration ……………………….. [WARN] |
| WARN NUMA nodes unavailable on host 127.0.0.1: exec: “numactl”: executable file not found in \$PATH |
| ✓ duplicatePartitionDatabase ……………….. [PASS] |
| ✓ tracelogOOM …………………………….. [PASS] |
| ✘ transparentHugepage ……………………… [FAIL] |
| FAIL /sys/kernel/mm/transparent_hugepage/enabled is [madvise] on 127.0.0.1 |
| FAIL /sys/kernel/mm/transparent_hugepage/defrag is [madvise] on 127.0.0.1 |
| NOTE https://docs.singlestore.com/db/latest/en/reference/troubleshooting-reference/query-errors/issue--inconsistent-query-run-times.html |
| ✓ defunctProcesses ………………………… [PASS] |
| ✓ orphanDatabases …………………………. [PASS] |
| ✓ pendingDatabases ………………………… [PASS] |
| ✓ orphanTables ……………………………. [PASS] |
| ✓ leafPairs ………………………………. [PASS] |
| NOTE redundancy_level = 1 |
| ✓ unrecoverableDatabases …………………… [PASS] |
| ✓ unkillableQueries ……………………….. [PASS] |
| ✓ versionHashes …………………………… [PASS] |
| ✓ filesystemType ………………………….. [PASS] |
| ✓ runningAlterOrTruncate …………………… [PASS] |
| ✓ leavesNotOnline …………………………. [PASS] |
| ✘ maxMapCount …………………………….. [FAIL] |
| FAIL vm.max_map_count = 262144 too low on 127.0.0.1 |
| NOTE https://docs.singlestore.com/db/latest/en/reference/configuration-reference/cluster-configuration/system-requirements-and-recommendations.html |
| ✓ defaultWorkloadManagement ………………… [PASS] |
| ✓ longRunningQueries ………………………. [PASS] |
| ✓ diskUsage ………………………………. [PASS] |
| ✓ validLicense ……………………………. [PASS] |
| NOTE you are using 32.0 GB out of 320.0 GB cluster capacity (licensed: 320.0 GB) |
| NOTE License expires on 2020-01-31 08:00:00 UTC |
| ✓ cpuFeatures …………………………….. [PASS] |
| ✓ unmappedMasterPartitions …………………. [PASS] |
| ✓ blockedQueries ………………………….. [PASS] |
| ✓ orchestratorProcesses ……………………. [PASS] |
| ✓ delayedThreadLaunches ……………………. [PASS] |
| ✓ disconnectedReplicationReplicas …………….. [PASS] |
| ✓ minFreeKbytes …………………………… [PASS] |
| ✓ cpuModel ……………………………….. [PASS] |
| NOTE Intel(R) Core(TM) i7-6567U CPU @ 3.30GHz on all |
| ✓ readyQueueSaturated ……………………… [PASS] |
| ✓ failureDetectionOn ………………………. [PASS] |
| ✓ collectionErrors ………………………… [PASS] |
| ✓ secondaryDatabases ………………………. [PASS] |
| Some checks failed: 44 PASS, 7 WARN, 3 FAIL |