SingleStore is a fast database that supports real-time ingestion, with highly parallel transactions and queries all at once. So, providing customers with an equally smooth experience while using our Cloud Portal UI is essential. To that end, we recently started a project to accelerate our Portal UI.
The primary goal was to minimize the initial portal loading times. On a closer look at the bottlenecks, the most critical optimization was to figure out ways to reduce the time the initial query takes to fetch all "required" data rendered after a user's successful authentication. We actively use GraphQL throughout SingleStore's front end to fetch data from the backend. Optimizing GraphQL queries became one of the most vital parts of this project, which brings us to the first golden rule of…
Asking only for things we need
It is tempting to add a new field to an already existing GraphQL fragment. This might reduce the number of queries and somewhat prevent redundancy in the codebase, but it comes at the expense of creating bulky queries that take forever to load. Instead, we decided to trim down our getInitialData query as much as possible.
For example: The getInitialData query had a main fragment called “ORGANIZATION_FRAGMENT” with several sub-fragments:
export const ORGANIZATION_FRAGMENT = gql`fragment Organization on Organization {...OrganizationDetailsInfoprojects {...ProjectInfo}subscriptions {...SubscriptionInfo}featureFlagList {...FeatureFlagInfo}settings {...Settings}}${ORGANIZATION_DETAILS_FRAGMENT}${PROJECT_FRAGMENT}${SUBSCRIPTION_FRAGMENT}${FEATURE_FLAG_FRAGMENT}${SETTINGS_FRAGMENT}`;
The settings fragment wasn’t actually required here since we only need these when a user accesses the Settings page. So, it can be safely removed from the Organization_Fragment.
.png?width=1120&disable=upscale&auto=webp)
And, we can simply ask for it inside the Settings tab by defining a separate query that requests this fragment as:
export const ORGANIZATION_SETTINGS = gql`query GetOrganizationSettings($id: ObjectID!) {organization(id: $id) {oorgIDsettings {...Settings}}}${SETTINGS_FRAGMENT}`;
Then, we call this query inside the Settings tab with Apollo’s useQuery hook.
function SettingsPage({ organization, reloadOrg }: Props) {const hasSCIMFeatureFlag = useFeatureFlag(FeatureFlagID.SCIM);const {data: organizationSettingsData,loading: organizationSettingsLoading,error: organizationSettingsError,refetch: organizationSettingsRefetch,} = useQuery<GetOrganizationSettings,GetOrganizationSettingsVariables>(ORGANIZATION_SETTINGS, {variables: {id: organization.orgID,},});
Removing other fragments like billing information wasn’t as easy — despite not being useful for the initial portal load — they were entangled with other parts of the Redux state. This requires the introduction of a loading Redux state for all such fragments while the necessary data is being fetched, and giving our Organization type a partialOrganization structure.
if (data.state === "success") {// the payload may not have all the default that we need// so we set them to not encounter some runtime errorsconst payloadWithDefaults = data.payload.map((org) =>convertPartialOrganizationToOrganization(org));const parsedData: LSM<Array<Organization>, string> = {...data,payload: payloadWithDefaults,};return {...state,data: parsedData,currentOrgID,};}return {...state,data,currentOrgID,};}
Nevertheless, the principle of asking what is required remains the same here, we just had to complete other code refactors to prevent things from breaking.
Splitting the getInitialData query
After successful authentication, the user is redirected either to their organization invitations or to the homepage of one of their organizations. The way we choose the organization to route to is a topic for another day — but the point is we only need data for that “one” organization to load. With the earlier structure of getInitialData,the query we were using to fetch the data for all the user’s organizations isn’t needed until the user switches to another organization using our “Organization Switcher”.
We decided to split our query into getInitialDataSingleOrganization and getInitialDataAllOrganizations. The first is the blocking one for the portal to load, while the other is fired just after — but would not block the initial render.
if (initialOrgID && initialOrgID !== "org-id") {return getApolloClient().query<GetInitialDataSingleOrganization,GetInitialDataSingleOrganizationVariables>({query: GET_INITIAL_DATA_SINGLE_ORGANIZATION,variables: {organizationID: initialOrgID,},}).then(({ organization, invitations }) => {dispatch(setCurrentOrganization({ orgID: organization.orgID }));currentOrgSet = true;dispatch(queryOrganizationsSuccess([organization], {edition: Edition.Standard,}));// ........handlePostSignInAnalytics({isFirstAppLoad: false,});queryInitialDataForAllOrganizations();}).catch(() => {// If the request fails, it's likely that the user does not// belong to the org that was in the URL or in local storage. If// the request fails for other reasons (network, bugs in the// code, etc.), it doesn't hurt to try the multiple// organizations request since that request can succeed.return queryInitialDataForAllOrganizations();});} else {return queryInitialDataForAllOrganizations();}
This arrangement of dispatching queries makes it faster, while still safe. Now that we have the flexibility to reduce the getInitialDataSingleOrganization as much as we want, we’re also backed by a safe and bulky getInitialDataAllOrganizations that doesn’t block the initial render.
Fixing slowness in our ‘Create Workspace’ form
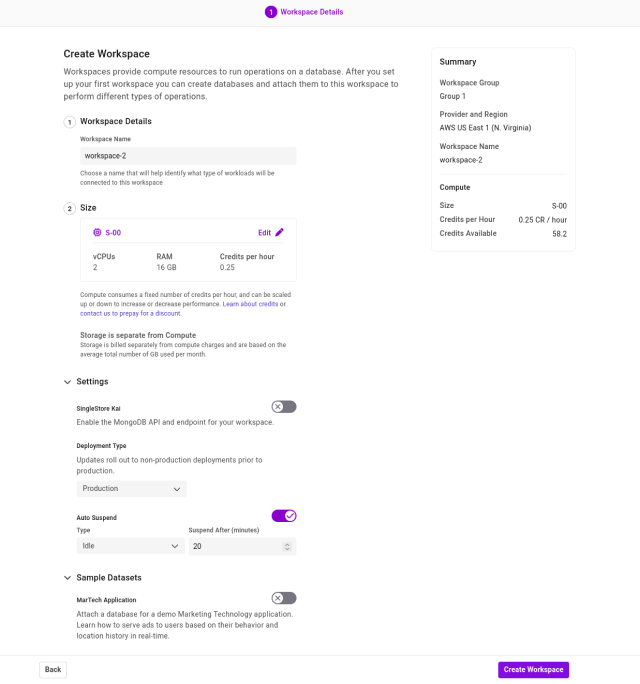
There was a certain slowness for bulky organizations accessing the “Create Workspace” form, particularly due to over-fetching workspaces data. We were fetching all available users’ workspaces to add a “unique-name” restriction to a workspace, which was only for the workspaces within a specific group. A simple modification to only fetch the workspaces within a workspace group helped us fix the slowness in accessing the form.
const skipWorkspacesQuery = !initialWorkspaceGroupID;const workspacesQuery = useWorkspaces({supportsWorkspaces: true,workspaceStatus: "all",workSpaceGroupID: initialWorkspaceGroupID ?? undefined,options: { skip: skipWorkspacesQuery },});
Creating a custom hook to replace the useQuery hook in Apollo Client
Apollo's useQuery hook is great but there are a few things to consider, especially when you are defining fetch policies for a query that has cache enabled. For example: defining fetch policy as “cache-and-network” would mean the following order of conditionals:
const { loading, data, error } = useQuery<>();if (data) {// ...} else if (error) {// ...} else {// ...}
It is important to evaluate the data state before the loading state, since checking the loading state first effectively invalidates the cache — and the spinner still shows for a fraction of a second, even if you have data available in the cache.
This effectively doesn’t use your defined cache policy, which can be prevented by simply inverting the if logic. For greater flexibility, we introduced a custom hook wrapper that manages these states properly and internally uses the useQuery hook. This also allows us to implement a default fetch-policy for the hook throughout the codebase.
export function useCacheNetworkQuery<TData = any,TVariables = OperationVariables,>(query: DocumentNode, options?: QueryHookOptions<TData, TVariables>) {const result = useQuery<TData, TVariables>(query, {...options,});const memoizedResult = React.useMemo(() => {const { data, loading } = result;return {...result,/*** follows the "stale while revalidate" pattern* and is only true is there was no previous data*/loading: !data && loading,/*** Is `true` when the query is in flight**/fetching: loading,};}, [result]);return memoizedResult;}
That’s all good, but how do we measure if there is any real progress with these changes? Well, for measuring the times and data size associated with queries, we can use the "Networks" tab for fetch requests.
Tools like Lighthouse and other Chrome developer tools give you a fair idea of performance insights, especially regarding metrics like First Contentful Paint (FCP) and Largest Contentful Paint (LCP). Still, they are not entirely reliable as they are system dependent.
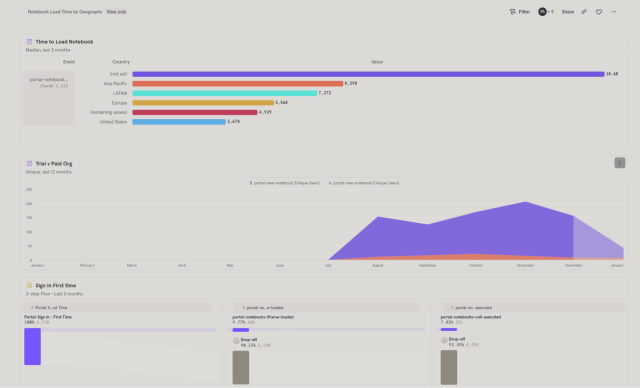
One thing we regret is not logging an analytics event to measure the time it takes the portal to load. Mixpanel is a wonderful tool to get these insights and estimates based on real-time data obtained by application users.
Looking for infrastructure changes
After GraphQL query optimizations, we realized we could benefit from infrastructure changes. On closer analysis, we found that our frontend assets — including bulky CSS sheets — needed to be compressed. Further investigation revealed that we had a persistent cache-miss state for our existing CloudFront configuration.
We changed the CloudFront configuration by adding the missing flags required to serve compressed front-end assets. We also improved the cache-miss state by excluding some parameters that were considered as a part of the cache-key hash. As a rule of thumb, the more parameters that define the cache-key hash, the more likely it is to have a cache-miss state simply because we expand the number of possible combinations.
resource "aws_cloudfront_cache_policy" "default" {name = "${var.portal_bucket}_default"min_ttl = 0default_ttl = 86400max_ttl = 31536000parameters_in_cache_key_and_forwarded_to_origin {headers_config {header_behavior = "whitelist"headers {items = ["Origin","Access-Control-Request-Headers","Access-Control-Request-Method","CloudFront-Viewer-Country","CloudFront-Viewer-Country-Region",]}}enable_accept_encoding_brotli = trueenable_accept_encoding_gzip = truequery_strings_config {query_string_behavior = "none"}cookies_config {cookie_behavior = "none"}}}
Gzip vs. Brotli
Since we set the corresponding flags for gzip and brotli encoding to true, we left our job on CloudFront to automatically compress with the best algorithm for the asset. However upon inspecting the requests, we found that bulky assets like CSS StyleSheets were being compressed in brotli compression. Also according to various internet sources, brotli has a slight edge over gzip compression.
After experimenting with the infrastructure changes, we gradually shifted toward optimizing our app bundle — the first step was obviously to analyze our bundle itself properly.
Analyzing the bundle
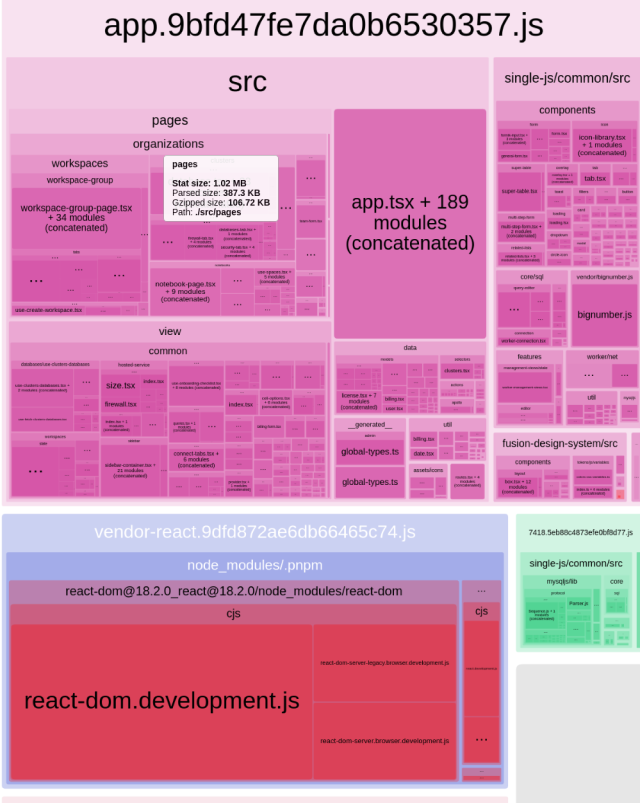
The Webpack BundleAnalyzer plugin is an excellent tool for analyzing the app bundle quickly. It displays each bundle's size before and after being minimized and compressed (gzipped).
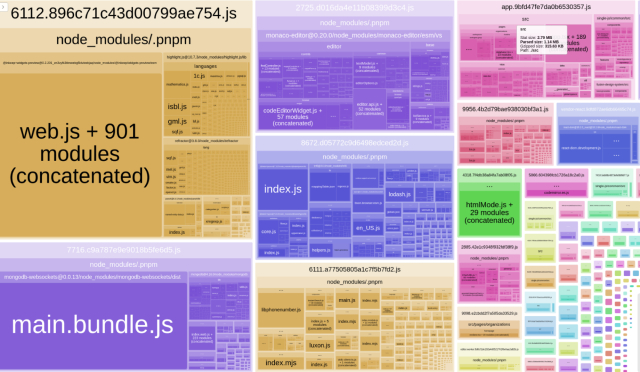
When we analyzed our bundle, the app size was a bit large (around 10.3 megabytes in size); luckily we were able to find that our SQRL chatbot was owing to approximately 50% of our app bundle's total size. This led us to try to lazy-loading it.
Lazy loading
Lazy loading is an excellent option for things that aren't required immediately at the initial app load time, and should only be loaded when the user accesses them. Since we didn't immediately need our chatbot on the initial app load, we could lazy load it and introduce a loading state.
const ChatBot = React.lazy(() =>import("view/common/chat-bot/chat-bot").then((module) => ({default: module.ChatBot,})));// ......if (matches("chatBot")) {menuContent = (<ChatBotProvider><ChatBot /><React.Suspensefallback={<FlexalignItems="center"justifyContent="center"style={{ minWidth: "450px", minHeight: "700px" }}><Loading size="large" /></Flex>}><ChatBot /></React.Suspense></ChatBotProvider>);}
This reduced our app bundle size by around 50%, with significant improvement in core performance metrics like First Contentful Pain — which was reduced by about 45%.
React vendor chunk setup
We decided to set up a separate chunk for React vendors like react, react-dom, react-router-dom, etc. This is vital because React vendors aren't frequently changed, and should not be downloaded every time there is a change in the app's bundle. Setting this up involved adding the following rule to splitChunk rules in our webpack configuration file.
reactVendor: {test:/[\\\\/]node_modules[\\\\/](react|react-dom|react-router-dom)[\\\\/]/,name: "vendor-react",chunks: "all",enforce: true,}
This reduced the effective size of the app bundle and was also particularly useful for the browser's cache. However, whenever we do a new front-end deployment, we still invalidate all of Cloudfront's cached assets, bringing us back to the cache-miss state as far as CDN cache is considered.
Treeshaking Lodash 👋
Lodash is a widely used utility library for JavaScript that provides various helpful functions to streamline and enhance the manipulation and handling of data structures, arrays, objects and more. While Lodash offers a comprehensive set of tools that simplify common programming tasks, one notable characteristic is its non-treeshakeable nature.
One solution to Treeshake Lodash was to replace all the default imports we had in our codebase with deep imports.
import _ from 'lodash'; // default importimport map from 'lodash/map' // deep import
However, there are more flexible solutions for replacement. Sometimes, it can cause naming conflicts for functions and variable names, which can be challenging to keep track of and lead to unexpected behavior.
We decided to go with the other solution of replacing Lodash completely with another alternative, "lodash-es", which is automatically tree-shakeable by webpack.
However, there's a catch!
The magic of wildcard imports!
Lodash-es isn't tree-shakeable when imported using default imports — and using deep imports would lead us back to where we started. The good news is we were lucky to find a hack that works just fine. Lodash-es is tree-shakeable when imported as a wildcard import.
import * as _ from 'lodash-es'; // wildcard import"
So, we replaced all default important instances of Lodash with wildcard imports of lodash-es, and modified the es-lint configuration file to restrict usage of lodash-es. We were able to get a reduction in app bundle size by around 85 KBs.
Conclusion
With constant codebase changes, this project does not have an end. There will always be further improvements and more optimizations for a faster, smoother Portal UI. However, with this initial push, we took a big step towards a smoother experience.
Finally, we are now tracking the initial load time via Mixpanel, so we will know if we accidentally make things worse again in the future.