
Real-time analytics is necessary to enable real-time decision making and to deliver enhanced customer experiences (download real-time whitepaper). Building a real-time application starts with connecting the pieces of your data pipeline. To make fast and informed decisions, organizations need to rapidly ingest application data, transform it into a digestible format, store it, and make it easily accessible. All at sub-second speed.
In this video, we show how an earlier version of SingleStore was able to serve as the core of a real-time analytics stack.
How SingleStore Supports Analytics
Let’s briefly review SingleStore’s analytical approach. SingleStore is a database that is a real-time database, the fastest database for operational analytics. SingleStore is scalable, so you can scale to as many nodes as you want to have in your system. And SingleStore uses the proven SQL syntax; it is a relational, SQL database at its core. SingleStore has been ranked by analysts as the number one database for operational analytics.
The mission of SingleStore is to make every company a real-time enterprise. We mean to enable every company to build a real-time data pipeline and to have real-time analytics on that pipeline. So we very much care, as a company, about accelerating the way you get analytics from your data as it comes in. (Editor’s note: This includes support for business analytics (BI) dashboards, as supported by major BI tools.)
The purpose of real-time analytics is, you want to gain insights that provide meaning to your business from data as it comes in. So you don’t want to do a batch job first, then do the analytics later, or the analysis later. You want to do the analytics as your data is piping into the system. Analytics is used for building a business intelligence dashboard that’s real-time, for improving the customer experience, for increasing efficiency and for creating new revenue opportunities.
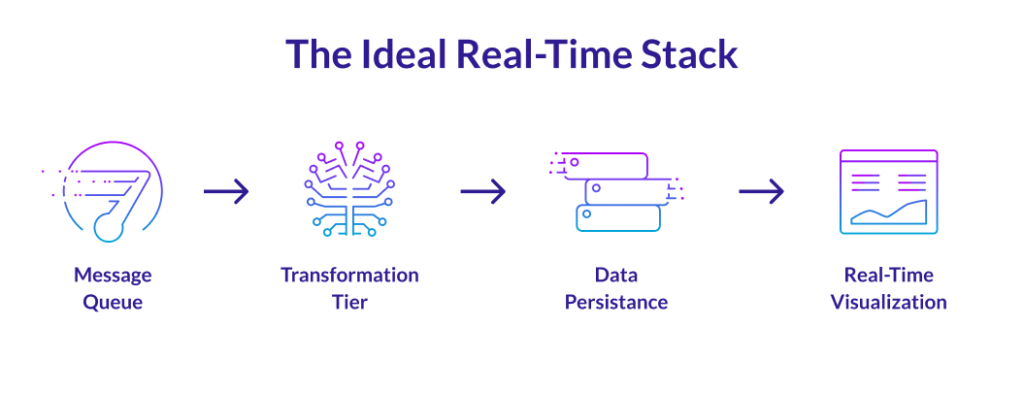
A typical real-time data pipeline is architected as follows:
- Application data is ingested through a distributed messaging system to capture and publish feeds.
- A transformation tier is called to distill information, enrich data, and deliver the right formats.
- Data is stored in an operational (real-time) data warehouse for persistence, easy application development, and analytics.
- From there, data can be queried with SQL to power real-time BI dashboards.
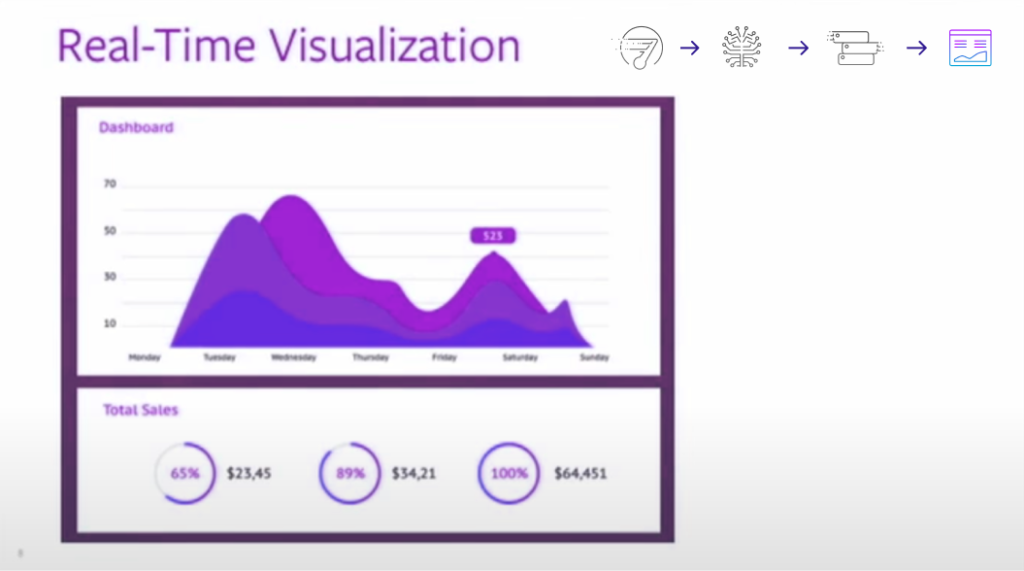
Let’s dive into understanding the ideal real-time stack. To create real-time analytics, to sell the idea of real-time analytics in the business, you need a BI dashboard. For all the customers we’ve worked with, there’s some sort of visualization. It’s either home-grown or it’s built using one of the third-party platforms: Tableau, Zoomdata, Looker, MicroStrategy, Qlik, you name it.
Now, the common element of all these business intelligence tools that support business dashboards like this is that they only provide the interface. They usually don’t provide the backing data store. You need a place that stores your data, that’s really fast, to be able to come up with the real-time insight.
And so, to be able to make your visualization real-time, you need a real-time backing store. Moreover, these sorts of visualizations only attach to backing stores that speak a certain language, meaning they have to be compliant with certain syntax, the most prevalent of which out there is SQL.
In the image above, the one in the very right is real-time visualization. Next to it is this data persistence piece.
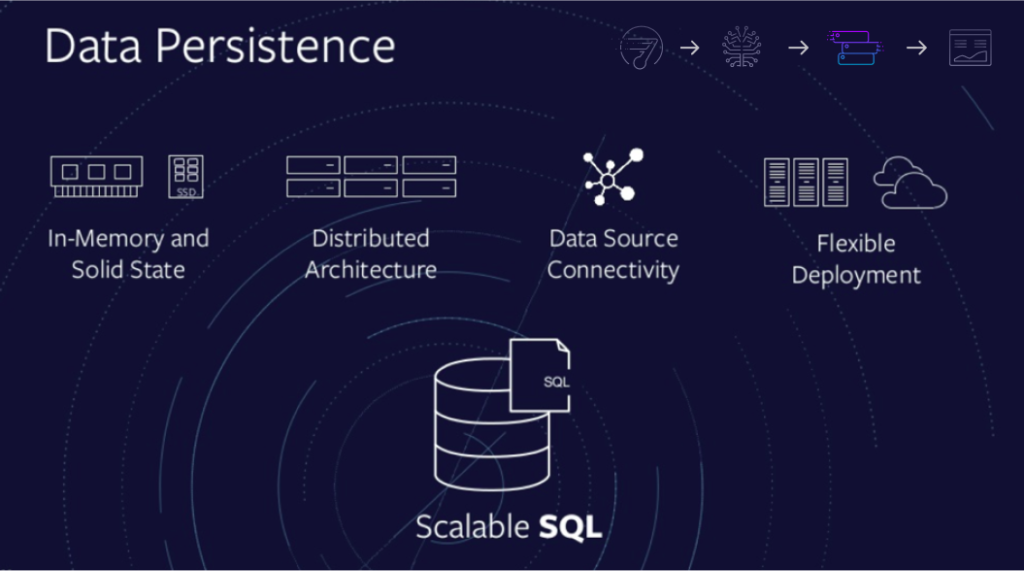
Following are four characteristics of a data persistence element for real-time analytics:
- In-Memory and Solid State. It needs to leverage in-memory and solid state storage. If you have a database that doesn’t have the ability to use in-memory and solid state storage these days, it’s probably not fast enough for your purposes.
- Distributed Architecture. The fastest databases are distributed, because you want to be storing your data in many nodes and processing all of that in parallel. You want massively parallel processing to be able to retrieve your data.
- Data Source Connectivity. You need a data persistent store that can connect to various sources. It’s not important only to support pure SQL coming in, but the data store needs to be able to go and grab data from other sources.
- Flexible Deployment. You need to deploy it on the cloud and on-premises. More and more workloads that we see are moving to the cloud, and the cloud is an increasingly strong player in this space.
So in other words, SingleStore is actually all the above four points. We are a scalable, SQL database. So, when you think about SingleStore, think about it as you would think about MySQL or PostgreSQL or Oracle, SQL databases that are compliant with the ANSI SQL standard The difference is that SingleStore has the ability to scale.
The Pinterest Use Case
When you use Pinterest, all the pins and re-pins that you do from your mobile devices or from the desktop are pumped into Kafka. And from Kafka, they are then enriched in Spark. They actually add location information and other information to it, and then store it into SingleStore.

From SingleStore, they can then perform queries, ad hoc queries, to test. Usually they do A/B tests for ad-targeting purposes. And the big sort of innovation, or the big technical benefit here, is that they are doing one gigabyte per second of ingest, so that is around 72 terabytes of ingest, and they’re getting real-time analytics from all that data streaming into the system.
An Energy Use Case
This energy company has created a real-time analytics pipeline to determine the current state of their drills. This is an oil and gas company drilling for oil. If they drill in a certain direction, and the drill hits bedrock, that is very bad. Each drill bit costs them millions of dollars. So, what they need to do is determine, in real-time, whether or not the drill is going the right way.
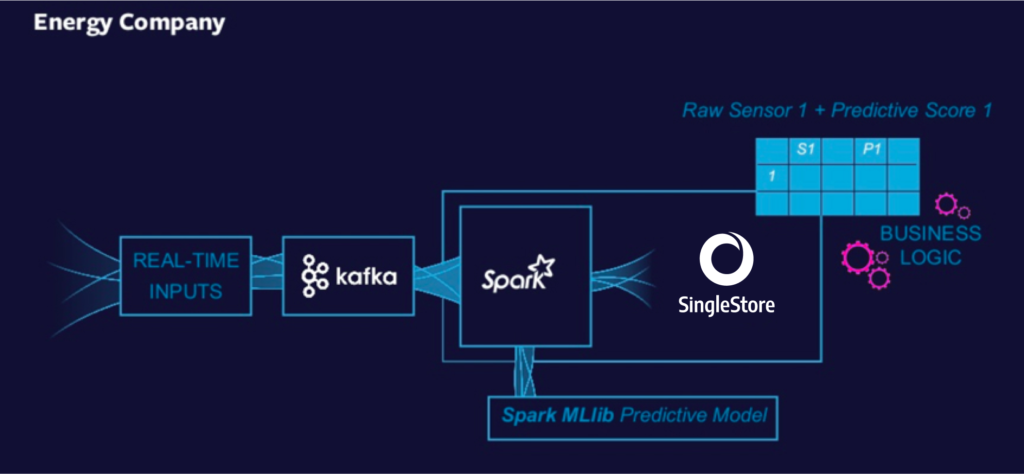
So, they have real-time inputs coming from their sensors. They pump all that information into Kafka – all the sensor information from all their drill bits. Once there, the data is sent through Spark, and they run a predictive analytics model on it.
The model is developed in SAS, and they use Spark to run it – to execute the machine model, or to do the model scoring. Once there, they can then put the results in SingleStore to be able to decide whether or not they should take certain proactive actions with their drill bits. So, this is another example of a real-time data pipeline that provides real-time analytics.
And finally, just to bring it all home. Refer to the demo below, and you can view the presentation.
Wind Turbines Demo
The image here shows you data from 2 million sensors that are on wind turbines located all over the world. This demo is a simulation. The locations of the wind turbines are real. This is a real data set, but the activity of the sensors is what’s simulated here.
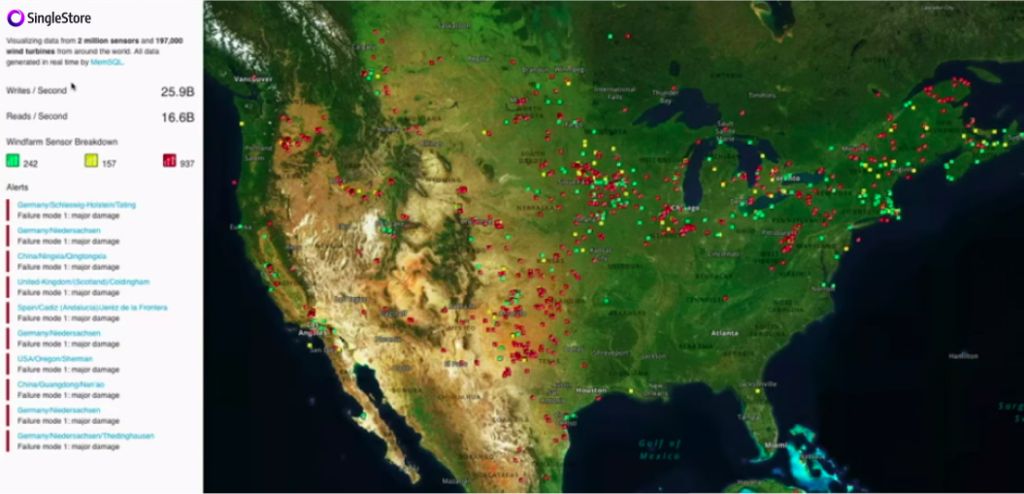
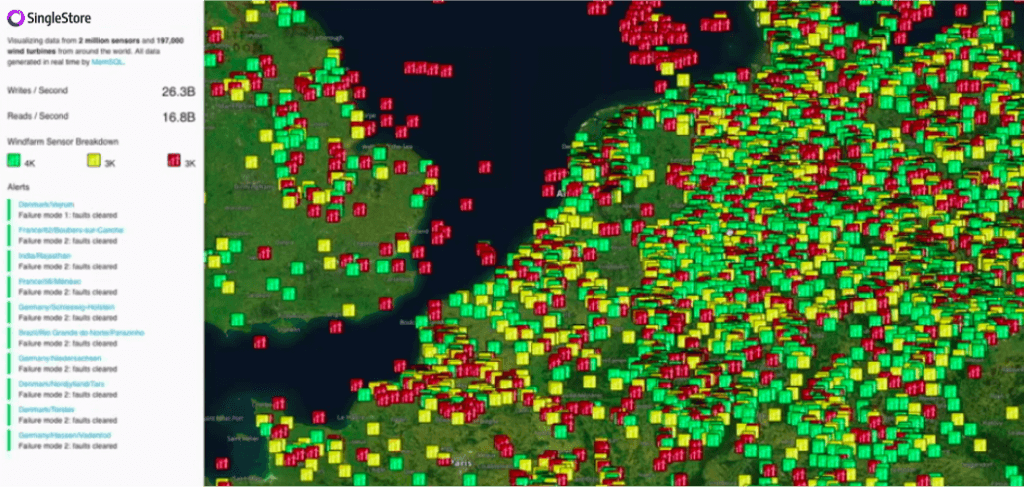
You’ll notice here that I can move around the globe and see where all my wind farms and wind turbines are. I’m specifically going into Europe, because I know that there are lots of wind farms and wind turbines in eastern Europe.
The pipeline here is as follows. All the information from all of these is very similar to the energy company use case that I was just mentioning. All the data from all these wind turbines, each of them has sensors, and that data all goes into Kafka. From Kafka, it then goes into Spark, and there, we perform a simple regression analysis model to determine where or how we expect the wind turbine to behave.
So, the ones that we see as yellow or green or red, essentially is our prediction of how those turbines will behave over time. So the ones that are red, we expect that you should probably replace it soon. The ones that are yellow are getting there. And you’ll notice that the red ones eventually turn to green, because of the expectation is that it’s a model where things are slowly decaying over time or degrading over time, and then they get repaired. And they’re degrading and then they get repaired. So you can see here a visualization of all that in real-time.
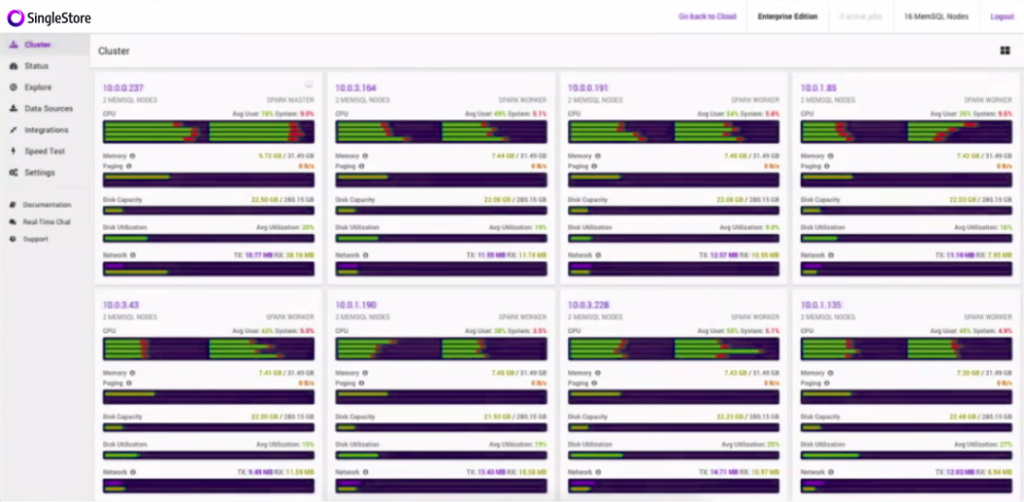
This is a view of SingleStore Ops, which is our graphical dashboard for looking at the SingleStore clusters. (Editor’s note: SingleStore now also offers SingleStore Studio, a more advanced graphical interface.) As I described earlier, SingleStore is a distributed database, which means it exists or you install the same software across many systems, or across many machines.
So here you see it has 16 machines, and all those machines are humming. If you see those green, it means that the CPU is going with SingleStore. So, why is it going? It’s because in real-time, the data is coming from Kafka to Spark to SingleStore, and rendered here in this dashboard. So, you can notice that sort of every second, it’s refreshing, showing users new insights based on real-time data that’s coming into the pipeline.
Conclusion
To learn more about how SingleStore supports generating analytics in real time, view the recorded presentation and review the slides. Also, you can read more in our resource center.